In this tutorial, we’ll look at how to set up a Lidar sensor map in Python. The lidar sensor is used for spatial orientation and mapping.
Lidar sensor description
The lidar sensor is a laser distance sensor coupled to a motor that drives it. It behaves like a radar, detecting obstacles at 360 degrees and mapping space. It is often used in robotics to map and locate an environment and enable autonomous movement.
The Lidar sensor uses a serial interface card to connect it to a computer via a USB port.
To find out which port the device is connected to, go to the Device Manager in the Ports (COM and LPT) section (here com3).

Lidar testing with the official Tool
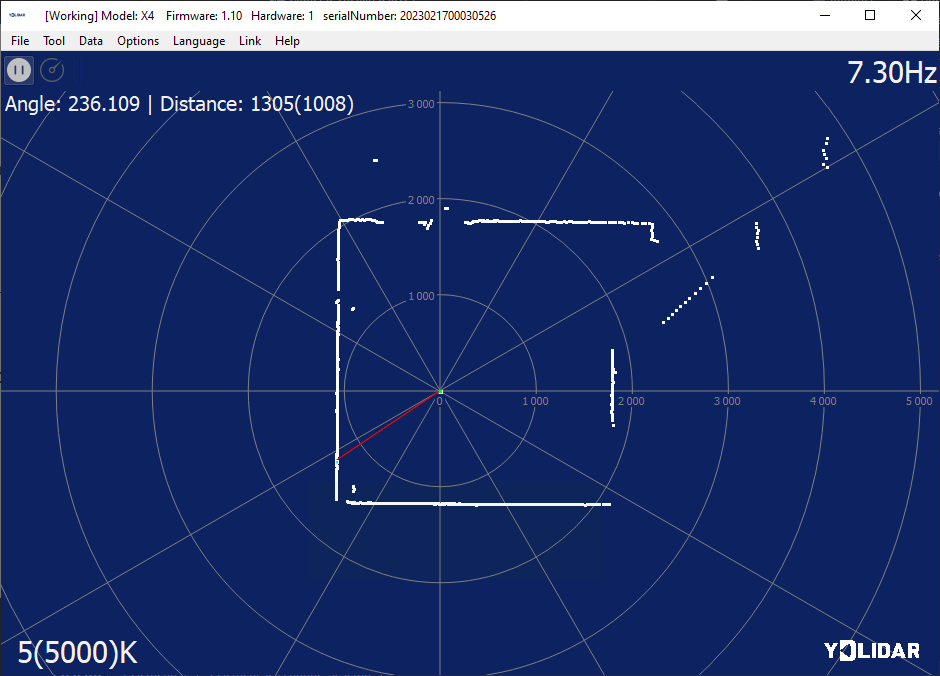
You can download the Tool interface from the official website. This tool allows you to visualize the cartography obtained using Lidar.
Once the software has been launched, simply select the device port and Lidar model. Once the Lidar is connected, you can start acquisition.
Installing the Python package
To use the Lidar sensor with Python, we use the PyLidar3 library.
python -m pip install Pylidar3
Lidar test script
To check Pylidar installation, you can use the following script, which simply displays the device information.
import PyLidar3
port = "COM3" #input("Enter port name which lidar is connected:") #windows
Obj = PyLidar3.YdLidarX4(port)
print("connecting to {}".format(port))

ret = Obj.Connect()
if(1):
	print(ret)
	print("device info: ",Obj.GetDeviceInfo())
	Obj.Disconnect()
else:
	print("Error connecting to device")
Scan result display
For our first mapping, we’ll initialize the PyLidar3 object and connect to the device.
Obj = PyLidar3.YdLidarX4(port)
ret = Obj.Connect()
Next, we’ll define a few scan parameters:
- scan duration scanDuration
- data threshold to be recorded dataThr
- winLim window limit
Finally, we’ll launch the lidar measurement and display the acquisition with matplotlib
import PyLidar3
import matplotlib.pyplot as plt
import math
import time

#init lidar
port =  "COM3" #input("Enter port name which lidar is connected:") #windows
Obj = PyLidar3.YdLidarX4(port) #PyLidar3.your_version_of_lidar(port,chunk_size)

ret = Obj.Connect()
print(ret)
#ret = Obj.Connect()
#print(ret)

#parameters
scanDuration = 30 #scan for 30 seconds
dataThr = 1000 # disgard data below this value
winLim = 5000 # window limit in X and Y

#init data list on 360deg
x=[]
y=[]
for _ in range(360):
	x.append(0)
	y.append(0)

if(1):
	deviceInfo = Obj.GetDeviceInfo()
	print("device info : ",deviceInfo)

	gen = Obj.StartScanning()
	t = time.time() # start time
	while (time.time() - t) < scanDuration:
		data = next(gen)
		for angle in range(0,360):
			if(data[angle]>dataThr):
				#x[angle] = data[angle] * math.cos(math.radians(angle))
				#y[angle] = data[angle] * math.sin(math.radians(angle))
				x[angle] = (x[angle] + data[angle] * math.cos(math.radians(angle))) / 2
				y[angle] = (y[angle] + data[angle] * math.sin(math.radians(angle))) / 2

		plt.clf()
		plt.axis([-winLim,winLim,-winLim,winLim])
		plt.title("Model: X4 Firmware: {} Hardware: {} SN: {}".format(deviceInfo['firmware_version'], deviceInfo['hardware_version'],deviceInfo['serial_number']))
		plt.scatter(y, x, c='r', s=8)
		plt.draw()
		plt.pause(0.1)

	Obj.StopScanning()
	Obj.Disconnect()
else:
	print("Error connecting to device")

plt.show()
Results
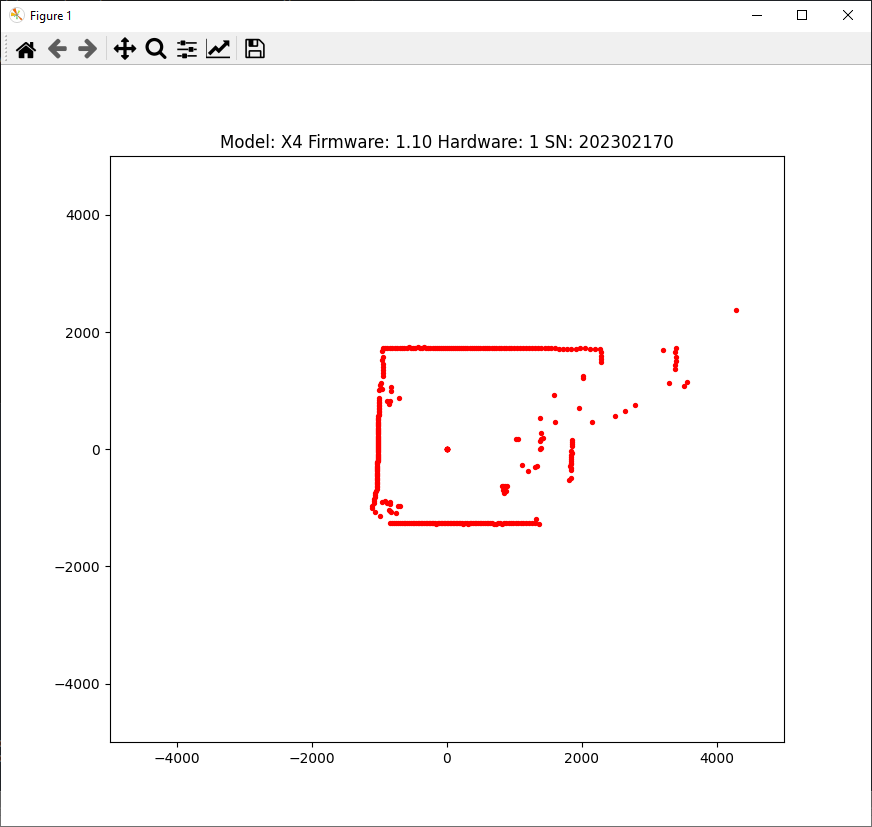
Once the script has run, we can see the mapping process in action and the map updating in real time.
Lidar management with threading
It is possible to manage the measurement in a different process from the display, for greater fluidity. As an example, we use the threading library. We’ll create a scan() data acquisition function, which we’ll then place in a thread.
threading.Thread(target=scan).start()
In this way, we can process the mapping data without disrupting the acquisition of the measurement.
import PyLidar3
import matplotlib.pyplot as plt
import math
import time
import numpy as np
import threading


#init lidar
port =  "COM3" #input("Enter port name which lidar is connected:") #windows
Obj = PyLidar3.YdLidarX4(port) #PyLidar3.your_version_of_lidar(port,chunk_size)

ret = Obj.Connect()
print(ret)
#ret = Obj.Connect()
#print(ret)

#parameters
scanDuration = 30 #scan for 30 seconds
dataThr = 1000 # disgard data below this value
winLim = 5000 # window limit in X and Y
buffnum = 1 # matrix size to average position

#init data list on 360deg
x = np.zeros((buffnum, 360))
y = np.zeros((buffnum, 360))

def scan():
	nb=0
	while is_scanning:
		data = next(gen)
		if nb>=buffnum-1:
			nb=0
		else:
			nb+=1

		for angle in range(0,360):
			if(data[angle]>dataThr):
				x[nb][angle] = data[angle] * math.cos(math.radians(angle))
				y[nb][angle] = data[angle] * math.sin(math.radians(angle))


if(1):
	deviceInfo = Obj.GetDeviceInfo()
	print("device info : ",deviceInfo)

	gen = Obj.StartScanning()
	t = time.time() # start time
	is_scanning = True
	threading.Thread(target=scan).start()
	while (time.time() - t) < scanDuration:
		xmean = np.mean(x, axis=0)
		ymean = np.mean(y, axis=0)
		plt.clf()
		plt.axis([-winLim,winLim,-winLim,winLim])
		plt.title("Model: X4 Firmware: {} Hardware: {} SN: {}".format(deviceInfo['firmware_version'], deviceInfo['hardware_version'],deviceInfo['serial_number']))
		#plt.scatter(y,x,c='r',s=8)
		plt.scatter(ymean,xmean,c='r',s=8)
		plt.draw()
		plt.pause(0.05)

	is_scanning = False
	Obj.StopScanning()
	Obj.Disconnect()
else:
	print("Error connecting to device")

plt.show() #keep figure open at the end
Application
- Mapping a space
- Robot positioning in space and obstacle avoidance
